September 19, 2023 another UVXY classic Volatility Setup
Sep 22, 2023
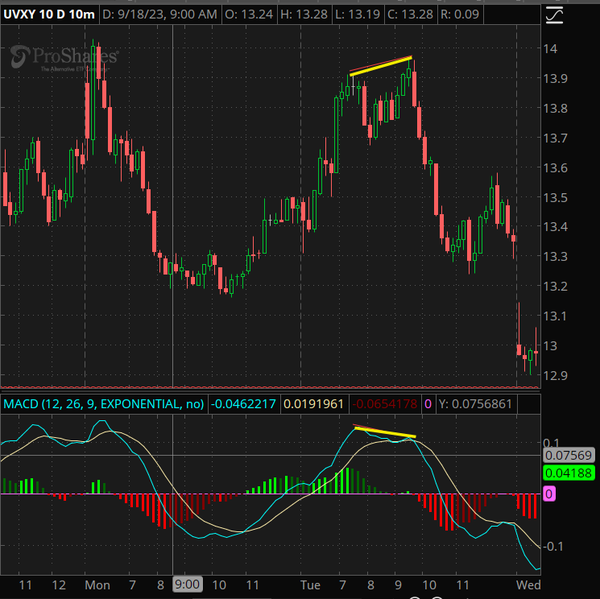
Tuesday September 19, we saw a divergence to the downside on UVXY on the 10-minute chart, indicating Volatility was about to head down despite UVXY prices being at a new high for the day. What Does This Mean? The markets are likely headed higher..
 |
The SPY 10-minute chart below shows us the MACD divergence up at the same time as the UVXY is doing the opposite. This provides us more momentum to the move thats coming.
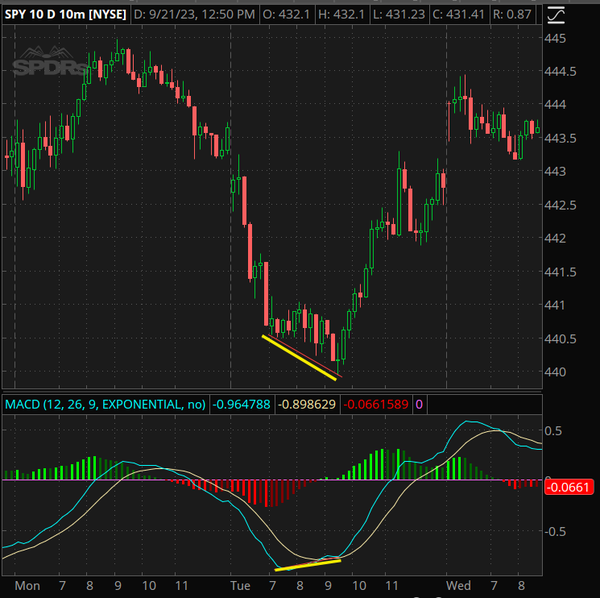 |
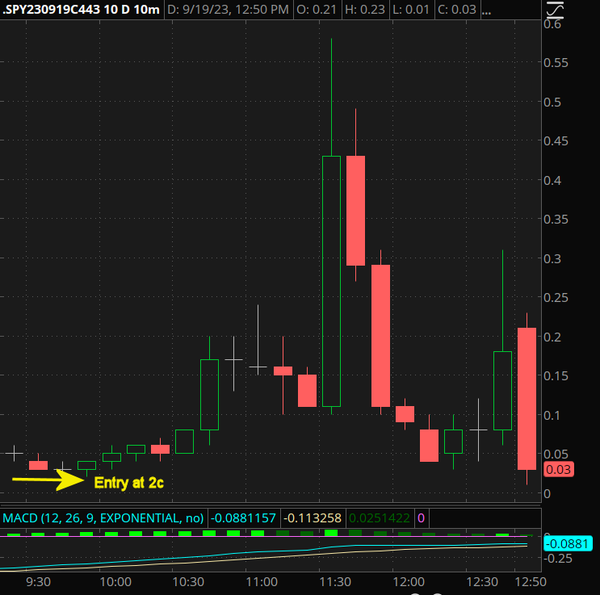
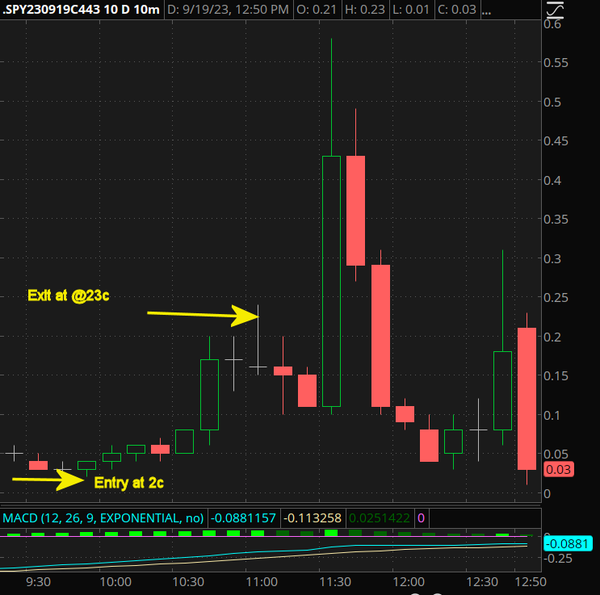
That upside divergence on SPY gives us confidence that the markets are likely to move higher. In the chart below we Selected OTM calls on SPY expiring the same day 9-19-23, the 443 calls gave us an entry for @2c.
 |
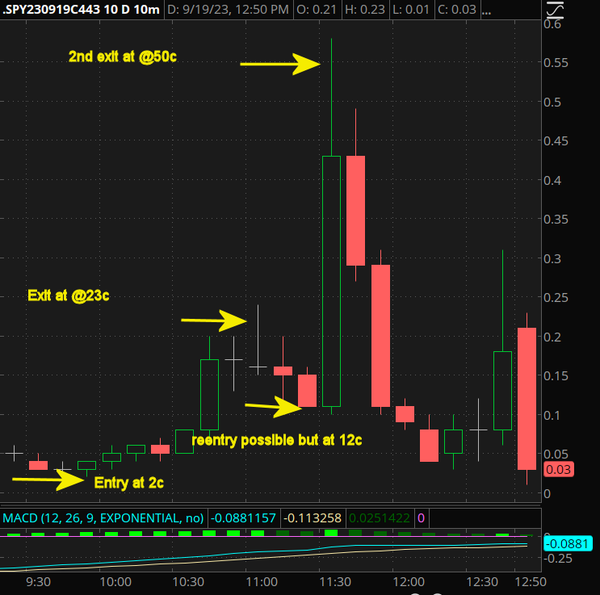
The MACD on the SPY 10-minute chart below turned down around 90 minutes into the trade. We could exit at around 23c for a nice 10 times your money.
.
 |
The SPY 10-minute chart below also gives us a possible reentry point shortly after the first exit. You can see this when the MACD bounces away from the signal line.
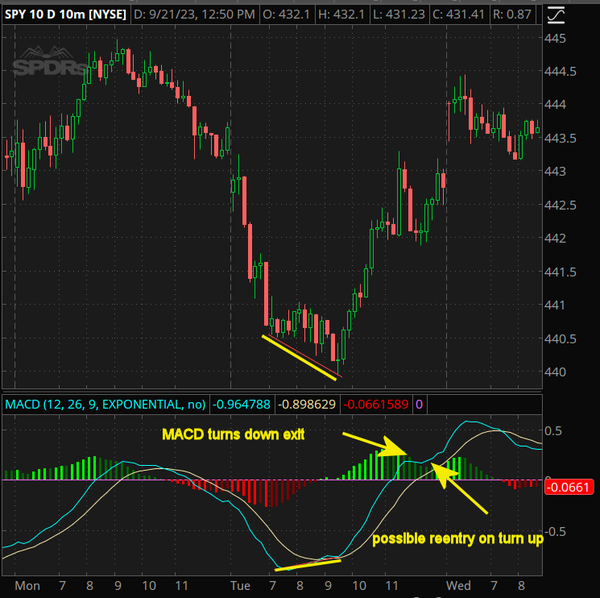 |
The reentry is a little pricey compared to our usual guidelines of under 10c. You could have gotten in around 11 or 12 c. If you'd held the position for only 10 minutes prices rose to over 50c.
|
Spend 2 days with Dale and live market action Learn how to fine tune your skillsOctober 18 - 19, 2023
PLEASE NOTE: We're limiting the number of attendees. January, April and July events SOLD OUT.
Don't hesitate or you'll miss out
Limited Seats Low Price Revealed athttps://www.theoptionshunter.com/live-trading-hours-zoom-with-october-2023Before Mid-November 2022, we could only trade QQQ and SPY options contracts that expired on Mondays, Wednesdays, or Fridays. Now we can pick any day of the week for expiration dates on QQQ or SPY options. Most stocks have option expiration dates each Friday. Due to high trade volume and demand for QQQ and SPY options contracts, market makers have expanded offerings to give traders more flexibility. That means more out-of-the-money options with little or no time premium every single day. What to Expect
October 18 - 19, 2023 at 10am eastern until ??Limited Seats Low Price Revealed athttps://www.theoptionshunter.com/live-trading-hours-zoom-with-october-2023Dale Wheatley, the Options Hunter, will share the knowledge you need to develop the skills to be successful. It’s time to take Control of Your Trading and apply the Options Hunter’s Straightforward Repeatable Approach to Extraordinary Wealth.
|