UVXY shows the way again
Jun 22, 2022UVXY, the ProShares Ultra VIX Short Term Futures ETF, has been providing the Options Hunter with detailed insight into the direction of SPY. Unlike VXX, the Volatility Index linked ETF, the UVXY provides us with a 1.5x leveraged measure of the VIX volatility. When UVXY goes up, it's a sign volatility on the market is going up and likely that SPY will go down. Because it's leveraged, the UVXY tends to be more reactive.
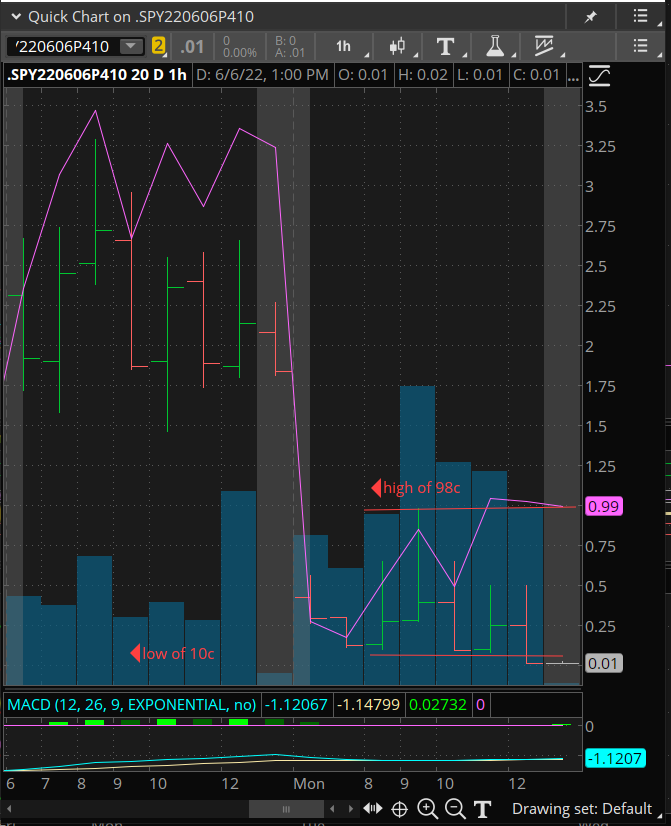
Incorporating UVXY as an ETF we monitor for MACD divergence gives us a rapid heads up of a direction change in the SPY. Nimble traders can profit quickly from these divergences on UVXY by trading OTM options on the SPY.
Dale gave us a great example on June 6, 2022
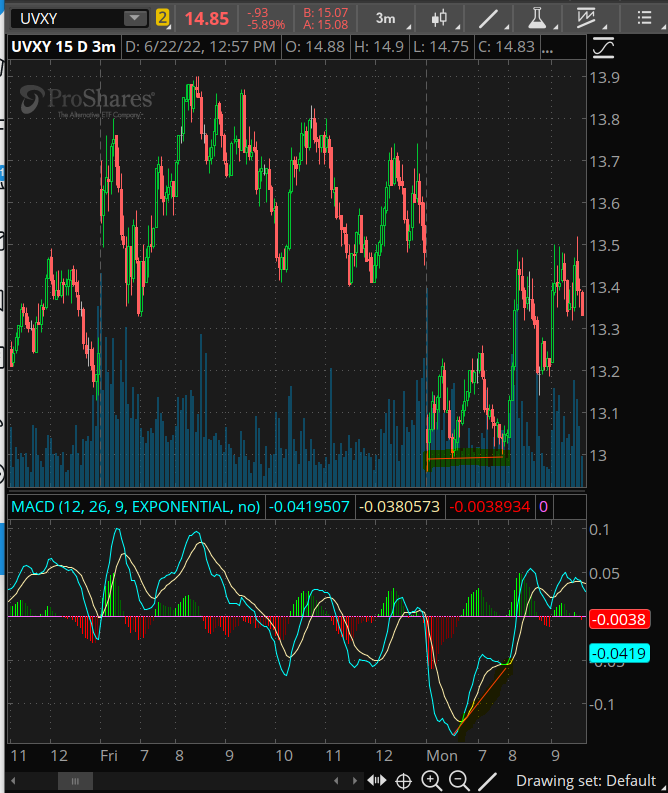
June 6, 2022 at 11am eastern (8am pacific) the UVXY was trading down close to $13, having been at that level an hour earlier as you can see in the 3 minute and 5 minute charts of UVXY below. In both charts the MACD is showing a clearly higher bottom at 11am vs 10am (8am vs 7am pacific). The price pattern has a classic inverse V shape we look for at the Options Hunter.