Mechanics of the VIX
Jun 02, 2022The Volatility Index (VIX) is a relatively new financial indicator. The VIX was first created in 1993 using options on the S&P 500, but has since expanded to include other indexes and options. The VIX measures the market's general expectation of volatility, and due to this, it is often used as a leading indicator of market volatility. The VIX is calculated using prices for call and put options on the S&P 500, so it represents expected future volatility of a future market path - it's not a market predictor in and of itself.
The VIX in technical terms is the volatility of a variance swap; the square root of the par variance swap rate for a 30 day term beginning on the present day. Simply, it is the anticipated annualized fluctuation in the S & P 500 index.
The volatility index (VIX) refers to a measure of implied market volatility. It tends to move inversely with the markets – when the market is in calm waters and low volatility, the VIX will be low – and will move in accordance to investor anxiety, typically increasing when fearful and selling pressure is on the rise, or decreasing when investors become complacent and greedy. The VIX is valuable data because it reflects the market's sentiment through investor anxiety.
If however there exists a skew on either side of the at-the-money strikes, this eventuality will point to a decided bias to market direction at the expense of another. Equity markets fall with far more momentum than they rise and so when out-of-the-money puts are in great demand and trading at an exceptional volatility premium to their counterpart equidistant from the underlying on the upside, the VIX will likely predict a substantial equity retracement.
If the opposite is true, where out-of-the-money calls are in great demand and so much so that a put equally out-of-the-money is far cheaper in volatility terms, it would appear that the S&P500 is about to experience a rally of great momentum. This very scenario is largely unprecedented but for a short lived spike upward in response to positive economic news; equity markets are slow to appreciate and extremely reactive to negative economic news.
Given its idiosyncratic behavior relative to other markets, the VIX continues to enjoy great legitimacy.
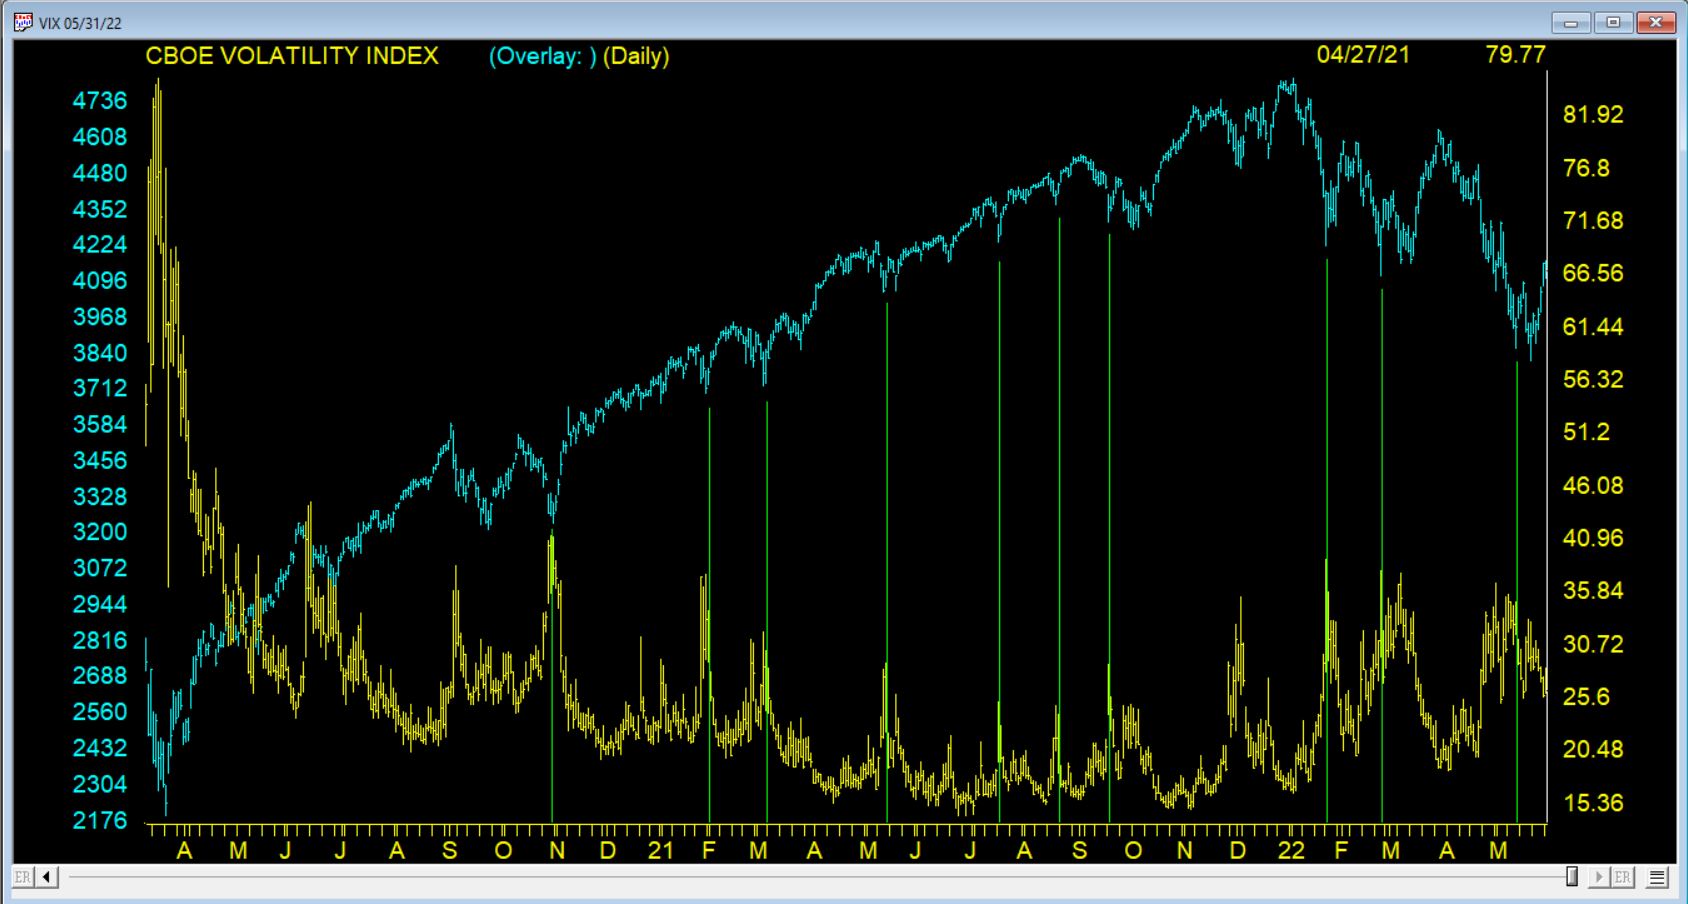
In this image we have a daily chart of the VIX in yellow overlaid on the S&P 500 index in green. Peaks in the VIX corresponding to low points in the S & P 500 are clearly illustrated.
At The Options Hunter we use the VIX and it's 1 1/2 x leveraged ETF UVXY for finding opportunities in the S&P500 ETF, SPY