IWM 10 minute charts May 3 - 4, 2022 several patterns, which to trade?
May 11, 2022During the May 3 and 4 trading sessions we monitored 3 divergences in MACD, two divergences up and one down with accompanying patterns on the 10-minute charts. Here are the three patterns we identified.
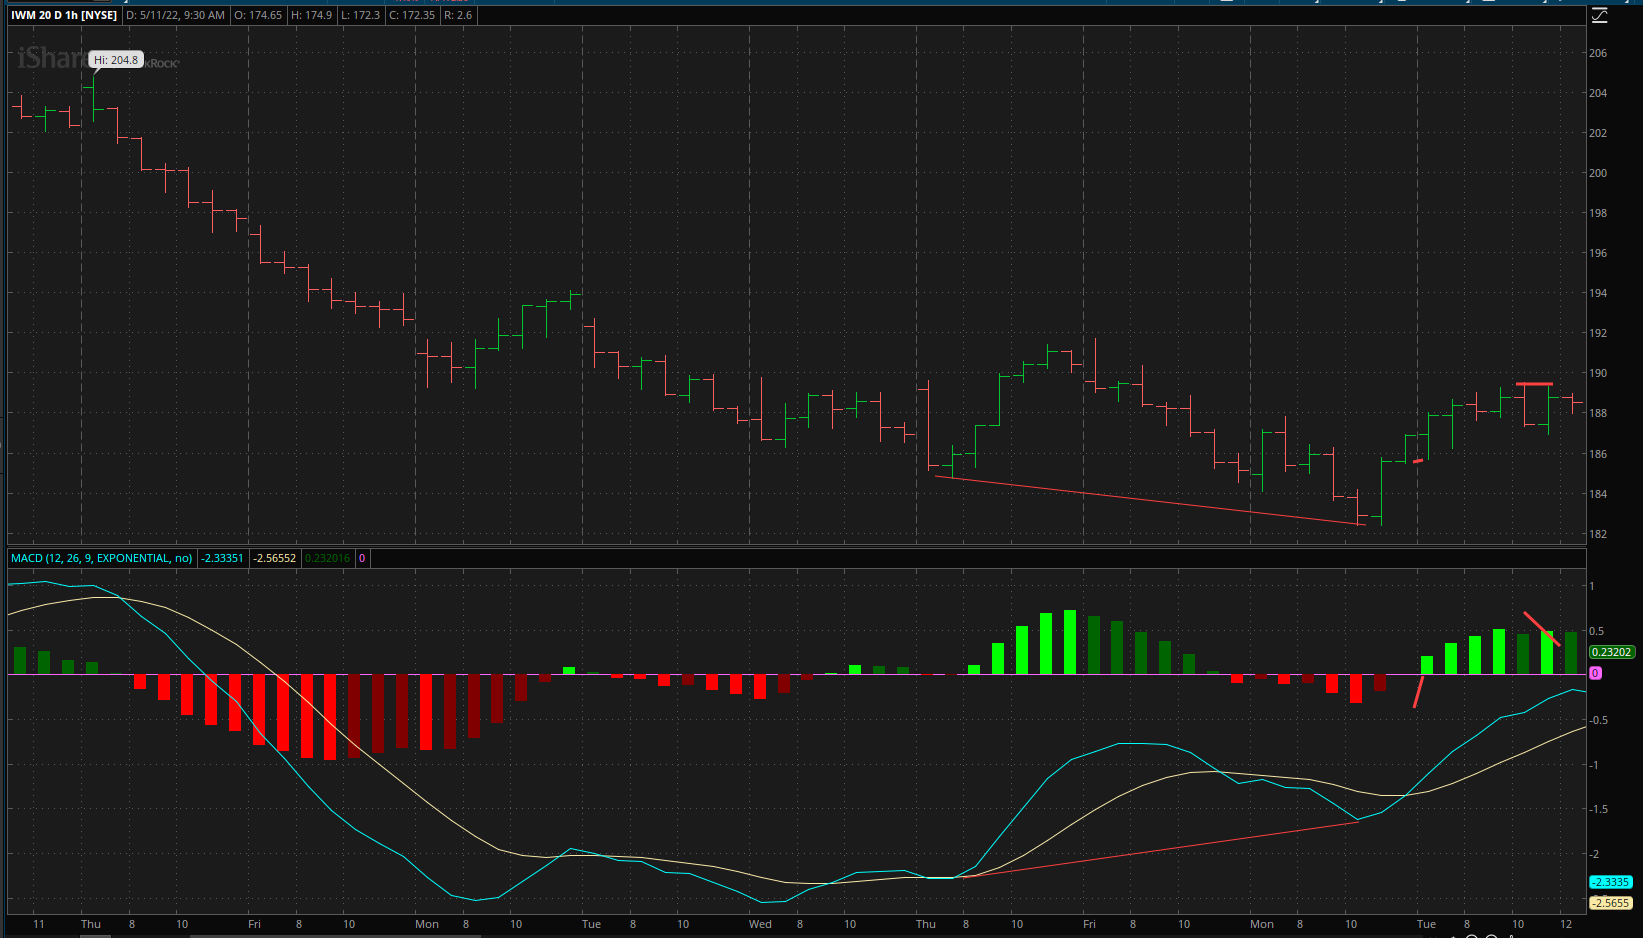
When considering the first MACD divergence up on May 2, 10 minute chart at around 2pm eastern, a look at the higher timeframe like the hourly chart below, gave us an MACD divergence to the upside at the same time.
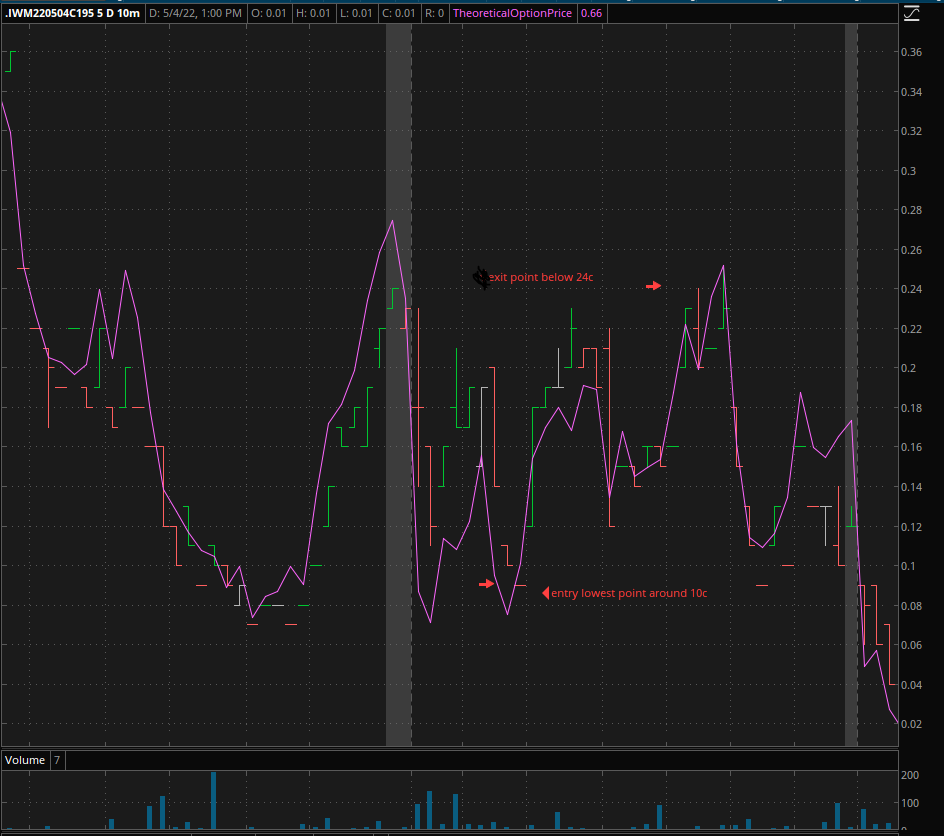
Selecting say the OTM 195 calls expiring May 4, 2022 (he closest expiration), entry at the divergence could have been had at around 10c. exit before the day was over around 20 to 24c was the best you could get from this modest move.
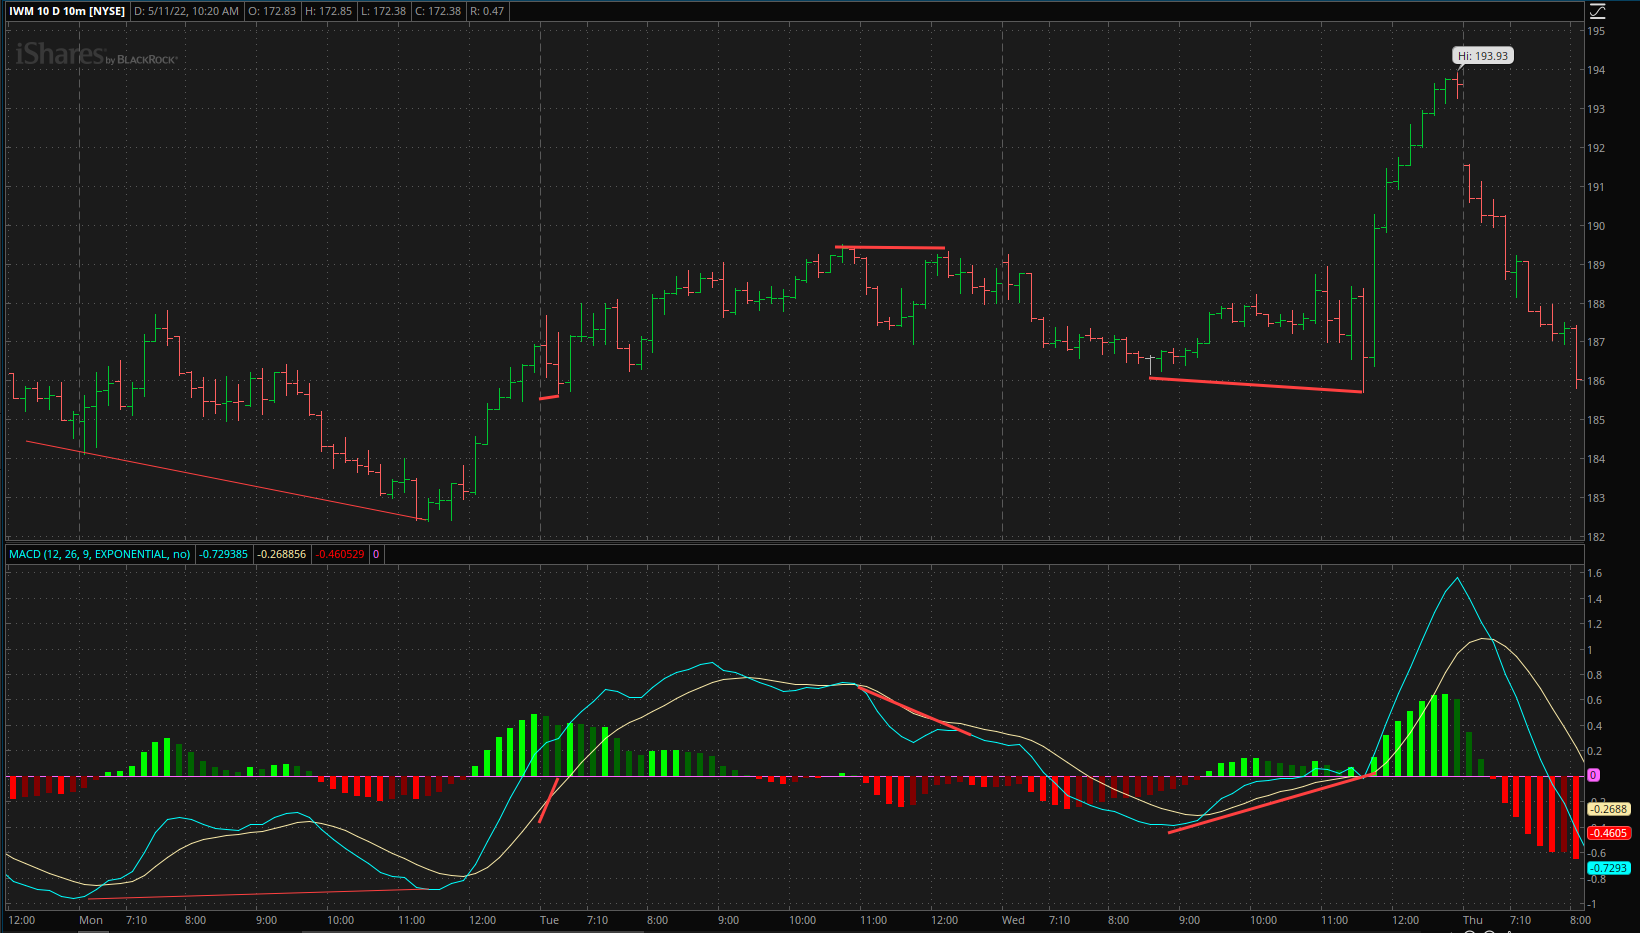
The divergence down, that was a fairly narrow double top on May 3 around 3pm eastern is clearly still within the influence of the hourly divergence up from May 2. Any trade here would be fighting against the longer term opposite pattern.
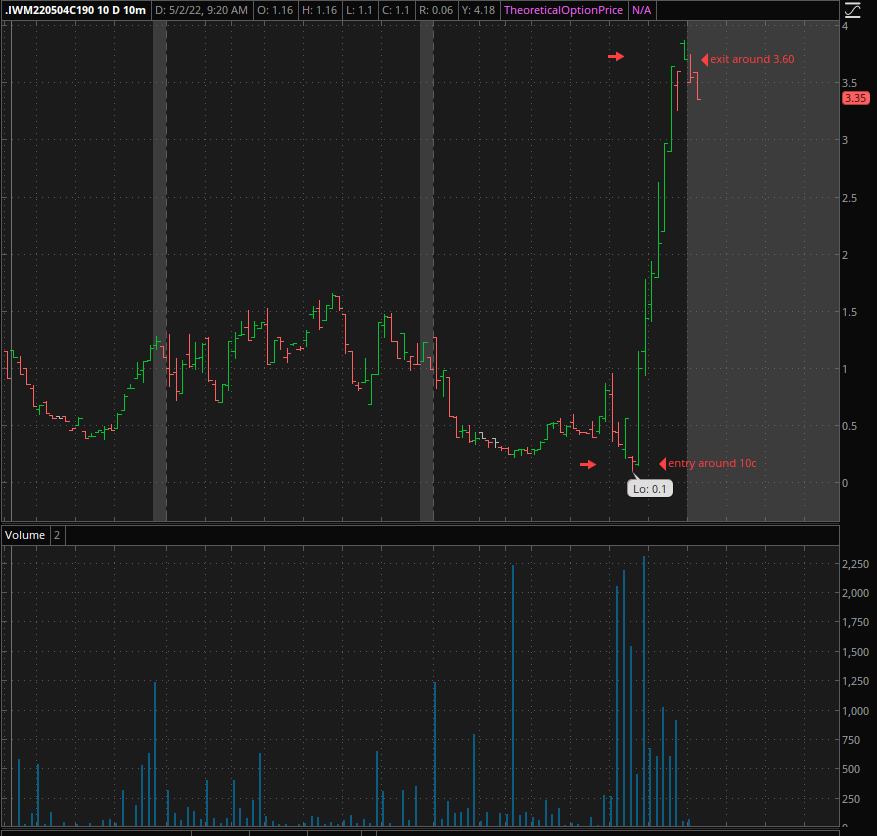
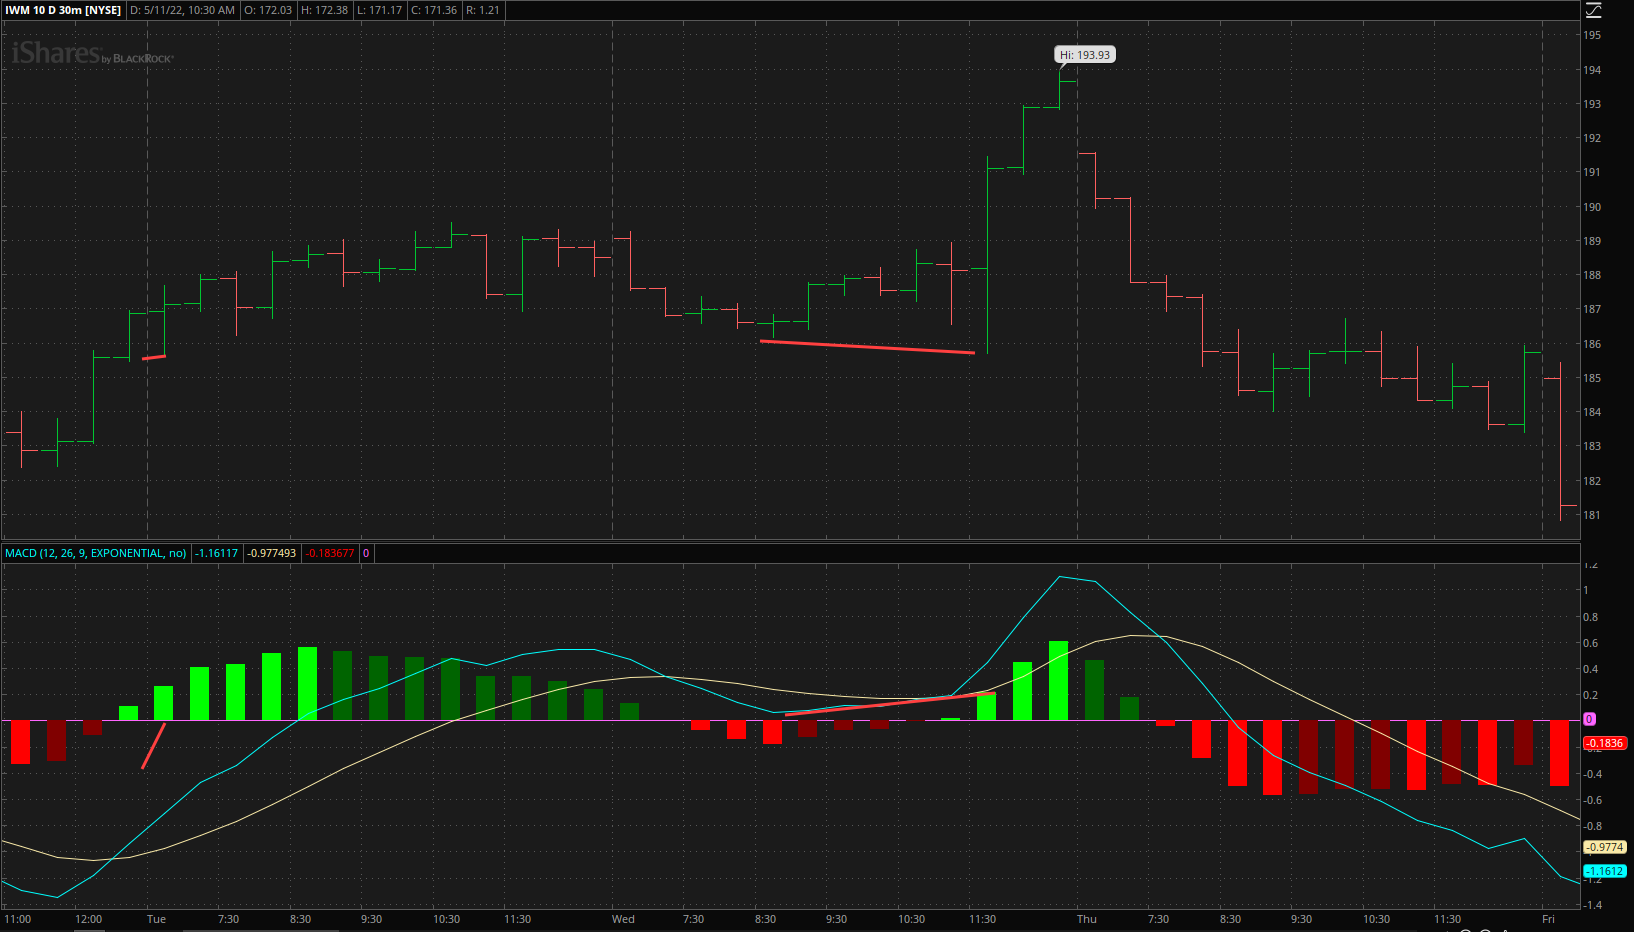
The third divergence was an upside one on May 4th at around 2.30pm eastern. Again looking at the higher timeframe in this case the 30 minute, a confirming modest divergence up occurred at the same time.
Selecting the 190 OTM calls expiring that same day, entry could be had around 10c, exit anywhere up to 3.60 for an impressive gain in under an hour.