
MACD Continuation
Sep 07, 2016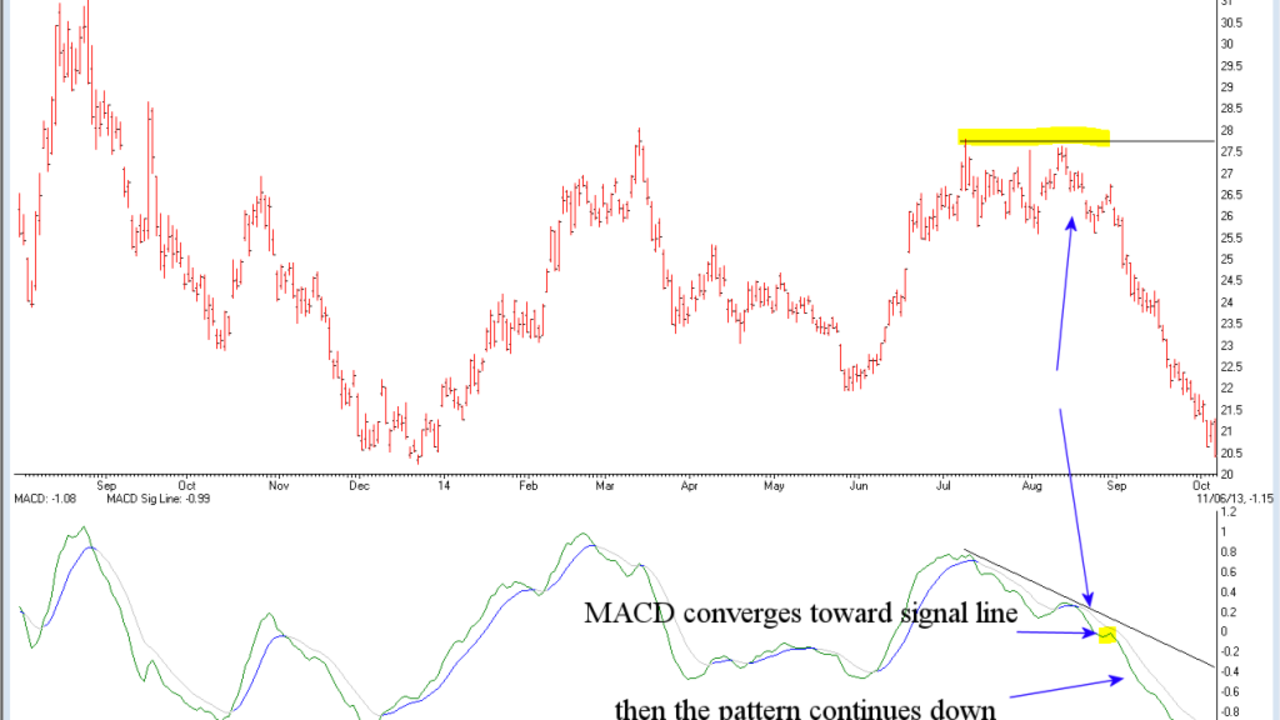
Moving Average Convergence Divergence or MACD is one of the most popular indicator that traders use when it comes to stock market. The indicator is composed of exponential moving averages, which determines the MACD by subtracting the 26-day exponential moving average from the 12-day exponential moving average. In addition, the 9-day exponential moving average that serves as the signal line and it functions as the initiator for the basic buy and sell signals. The indicator helps the traders on how they can find an entry or exit point when it comes to trade.
The continuation pattern in the MACD is useful for traders where they can find an entry point in a current trend. Buying into these trends using the MACD indicator, often yields high profits for the trader.
When you use the continuation pattern for MACD, always keep in mind that the values do not work in straight line. The prices move in a manner like a wave where the MACD line can be seen to head back toward the signal line. This chart of GDX clearly the MACD continuation pattern.
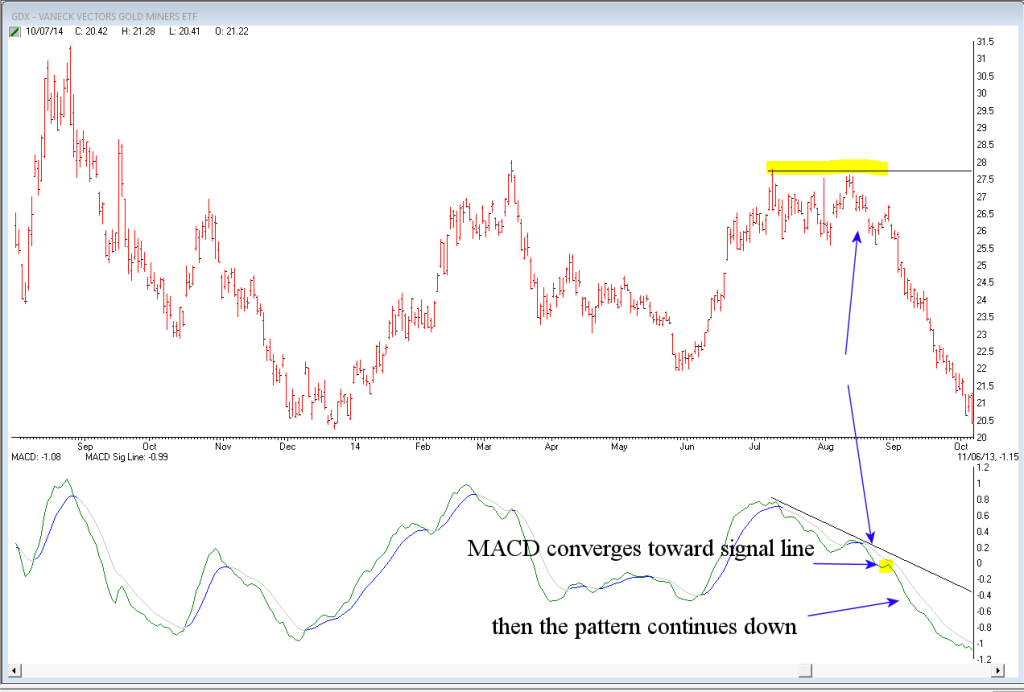
The chart pattern is most often seen when a pause is taking place when the downtrend or uptrend has happened. You’ll notice that while the MACD converges towards the signal line, it never crosses it, or completely changes direction. The MACD continues back in its previous direction providing a useful entry point into a trend already in place
When this pattern is used properly understood, the pattern can lead to big profits.