
Options Hunter Blog

Daily Bullish MACD Divergence -Trade Analysis IWM August 20, 2021
The Options Hunter Approach is based on four distinct aspects
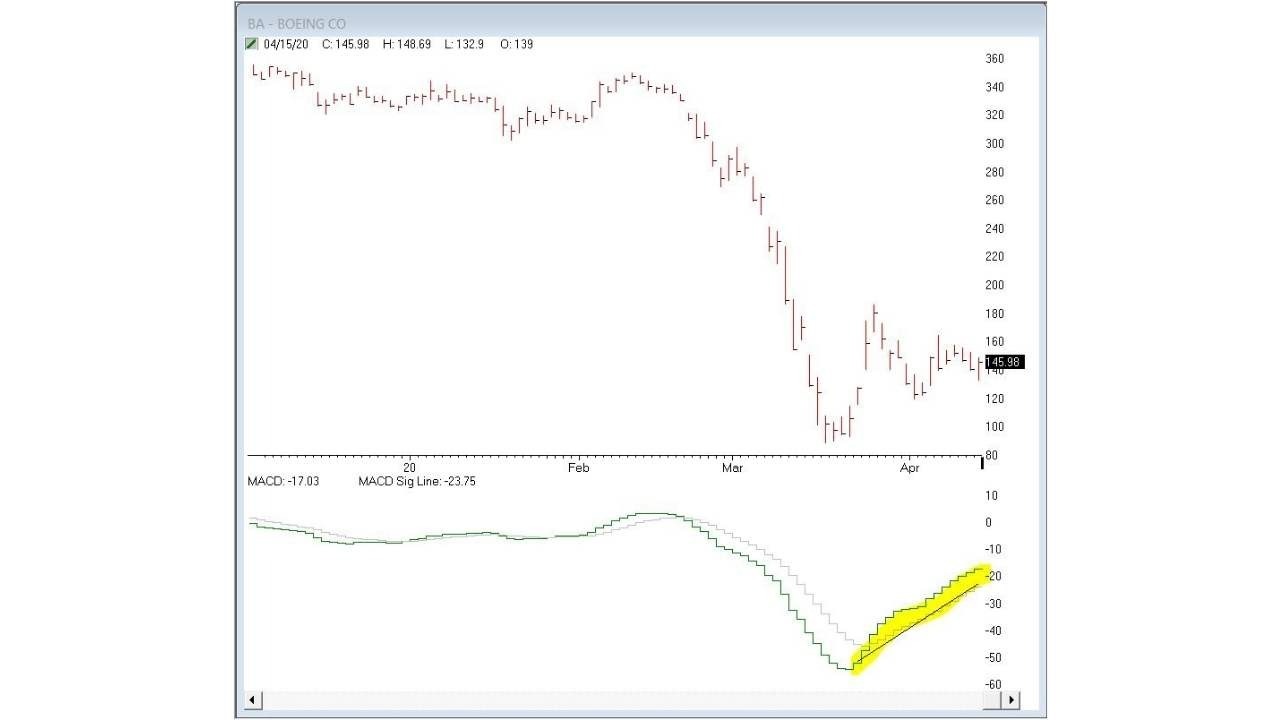
Step 1: Divergences in technical indicators warn that the current tre...

Volatility Index is an innovation that provides options traders with the opportunity to achieve spectacular returns rarely present in other options markets.
The index is based on the implied volatil...

Bullish MACD Divergence -Trade Analysis IWM
The Options Hunter Approach is based on four distinct aspects
Step 1: Divergences in technical indicators warn that the current trend is losing momentum ...

Bullish MACD Divergence -Trade Analysis NIO
The Options Hunter Approach is based on four distinct aspects
Step 1: Divergences in technical indicators warn that the current trend is losing momentum ...

|
|
Traders World: What is your background before you started trading options? Dale: I was a Telephone Contractor for many years and needed and wanted an investment vehicle that could ... |


Can't really miss these divergences on the hourly charts of CVX and XOM and picking up the out of the money option before the close on 9/15/20 was perfect timing.
Entry in the last 30 minutes of the ...

In spite of the bad news on retailers, I see many with strong monthly MACD chart divergences: BBBY, which I showed weeks ago in class & also LB, BGFV & many others. How can YOU find these before they ...
With all of the major components like AAPL, MSFT, AMZN down, it must be putting pressure on the indexes that they are a part of & how about Volatility(VXX)? Is is showing any clear upside patterns? Wh...

At 1:45pm eastern on June 12 the 5 minute chart on VXX made its way to the high it had reached 2 3/4 hours earlier, but we were concentrating on the MACD indicator. The MACD had a clear divergence i...

So, I'm sure there are many options traders, who are now at home and work, maybe even have a full house of family members. My commitments used to disqualify me from doing intraday options trading, n...
|
This is a daily chart with a clearly defined UPSIDE DIVERGENCE on VXX, the Fear Index. The time between the first price bottom to the second one, when the divergence occurred, was approxima... |


THE TRIFUSION WORKBOOK
Leverage over 20 Years of Expertise from an Exceptional Trader.
Free workbook
You're safe with me. I'll never spam you or sell your contact info.