
Options Hunter Blog
UVXY, the ProShares Ultra VIX Short Term Futures ETF, has been providing the Options Hunter with detailed insight into the direction of SPY. Unlike VXX, the Volatility Index linked ETF, the UVXY provi...
The Volatility Index (VIX) is a relatively new financial indicator. The VIX was first created in 1993 using options on the S&P 500, but has since expanded to include other indexes and options. The VIX...
During the May 3 and 4 trading sessions we monitored 3 divergences in MACD, two divergences up and one down with accompanying patterns on the 10-minute charts. Here are the three patterns we identifie...
There were a couple of patterns evident on April 13 and 14, 2022 on UVXY. There was a distinct 5 min chart upside divergence on UVXY at about 1.15pm EDT, 10.15 am PDT on April 13.
That led to modest ...
A classic triple bottoming pattern with an MACD divergence to the upside culminated on 3/18/22 with a huge upturn for facebook.
The first bottom with MACD divergence happened on 3/7/22 and was follow...
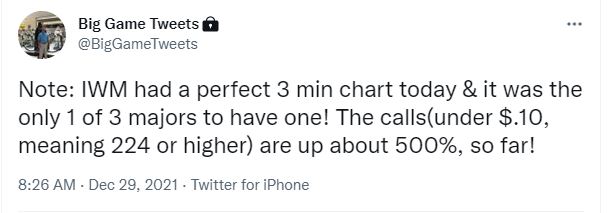
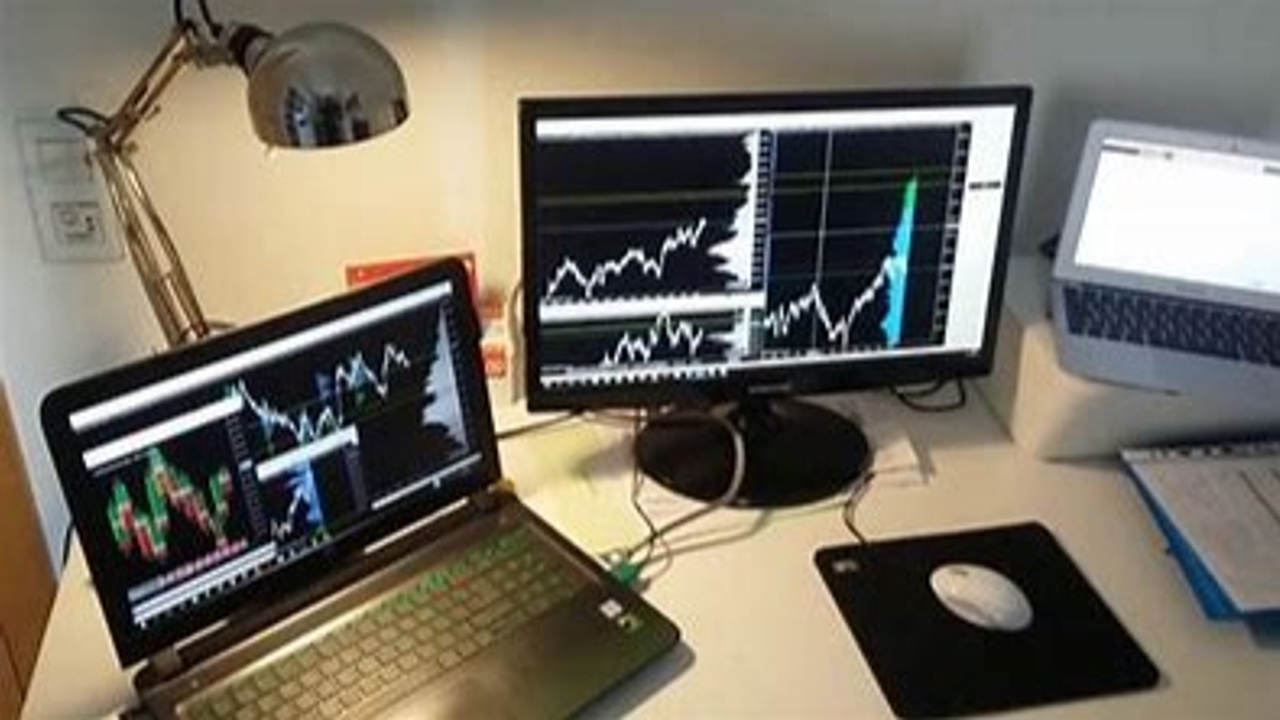
This setup on IWM happened in the first 45 minutes of trading on December 29, 2021. Notice the bottoming in prices at 10:15 eastern and the definitive MACD divergence up at that time in the Chart be...
We were watching several stocks towards the end of day on December 7, 2021. WMT was setting up a nice hourly divergence between the MACD and the price action. As prices bottomed in the morning of Dece...
How about that Monday turn around, did you see that coming? We went from the low on November 30 up by 2% on the SPY by 11.15am eastern. Were we wary? yes. Our daily SPY and weekly charts on SPY are st...
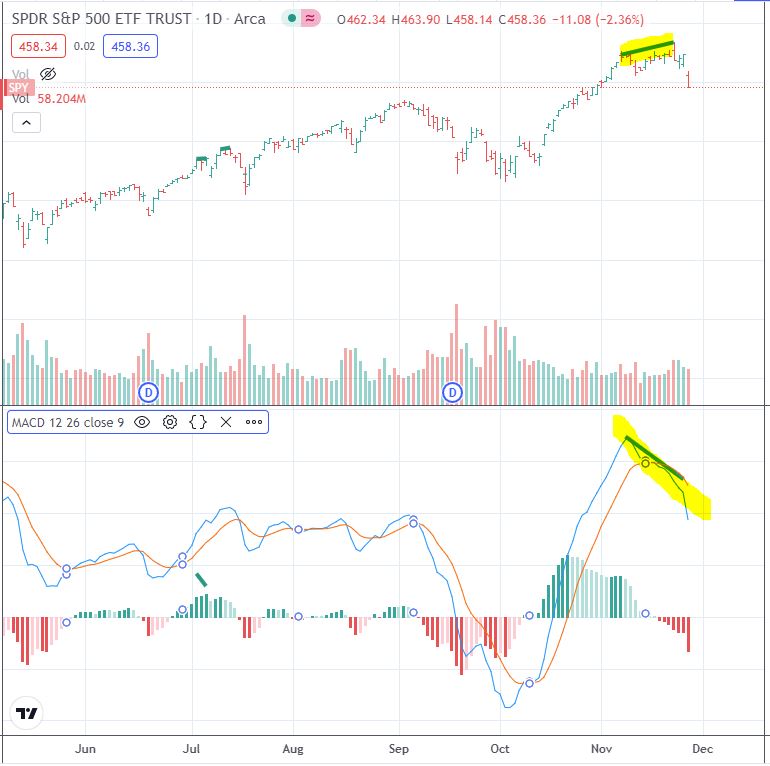
I hate to say I told you so, but we've been on a strong downside divergence on SPY for days. This daily chart says it all. I've tweeted to my Big Game subscribers about the SPY puts that gained 10,0...

Daily Bullish MACD Divergence -Trade Analysis ZM August 5, 2021
The Options Hunter Approach is based on four distinct aspects
Step 1: Divergences in technical indicators warn that the current trend...

THE TRIFUSION WORKBOOK
Leverage over 20 Years of Expertise from an Exceptional Trader.
Free workbook
You're safe with me. I'll never spam you or sell your contact info.